Mobile Shopping in Deutschland im europäischen Vergleich 2016
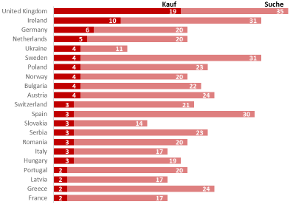 Die Infografik zeigt, auf Basis der Statistik einer Google-Umfrage zum Thema E-Commerce, die Produktsuche und die Einkäufe über das Smartphone in ausgewählten Ländern Europas. In Deutschland nutzen 20 Prozent der Bevölkerung das Smartphone zur Produktsuche und 6 Prozent kaufen mindestens wöchentlich Produkte über das Smartphone.
| Anbieter: | marktmeinungmensch | |
|---|---|---|
| Veröffentlicht: | Okt 2016 | |
| Preis: | kostenlos | |
| Studientyp: | Infografik • Marktforschung |
|---|---|
| Branchen: | Handel & Dienstleistung • Marketing & Medien • Online & IKT & Elektronik |
| Tags: | E-Commerce • Internetnutzung • Mobile Commerce • Mobile Shopping • Online Shopping |

| The Online & Multiscreen World | ||
| Device usage | ||
| What online activities do people do on their smartphones at least weekly? | ||
| Mobile-Shopping | Produktsuche am Smartphone | |
| Slovenia | 0 | 12 |
| Estonia | 1 | 15 |
| Lithuania | 1 | 18 |
| Russia | 1 | 9 |
| Belgium | 2 | 18 |
| Croatia | 2 | 30 |
| Czech Republic | 2 | 12 |
| Denmark | 2 | 19 |
| Finland | 2 | 19 |
| France | 2 | 17 |
| Greece | 2 | 24 |
| Latvia | 2 | 17 |
| Portugal | 2 | 20 |
| Hungary | 3 | 19 |
| Italy | 3 | 17 |
| Romania | 3 | 20 |
| Serbia | 3 | 23 |
| Slovakia | 3 | 14 |
| Spain | 3 | 30 |
| Switzerland | 3 | 21 |
| Austria | 4 | 24 |
| Bulgaria | 4 | 22 |
| Norway | 4 | 20 |
| Poland | 4 | 23 |
| Sweden | 4 | 31 |
| Ukraine | 4 | 11 |
| Netherlands | 5 | 20 |
| Germany | 6 | 20 |
| Ireland | 10 | 31 |
| United Kingdom | 19 | 35 |
| Question asked:How often do you - through your web browser or apps - ... on a smartphone? | ||
| Total Respondents: 22945 | ||
| Base: Internet users (accessing via computer, tablet or smartphone) | ||
| Source: The Connected Consumer Survey 2015 / 2016 | ||
| Filters Applied: DE; AT; BE; BG; HR; CZ; DK; EE; FI; FR; GR; HU; IE; IT; LV; LT; NL; NO; PL; PT; RO; RU; RS; SK; SI; ES; SE; CH; UK; UA | ||
© 2016 marktmeinungmensch